Action Research for Environmental Justice in the Kindergarten Classroom
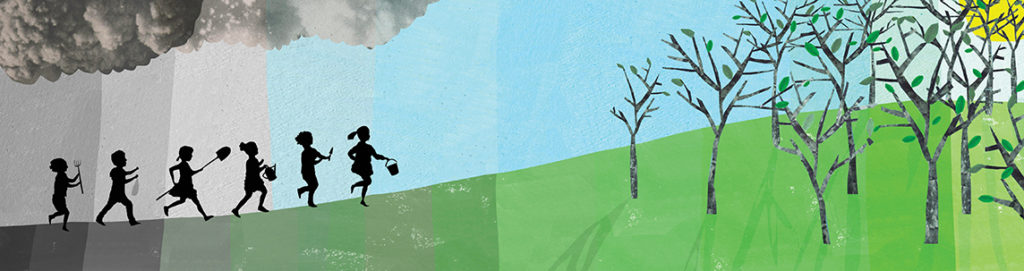
Illustrator: Katherine Streeter
On Oct. 31, 2021, world leaders gathered in Glasgow, Scotland, for the 26th U.N. Climate Change Conference of the Parties (COP26). This was the first time that countries had to explain on a global stage if they will achieve their climate targets. One of the day’s themes at COP26 was “youth and public empowerment.” However, students and youth around the world were demanding actionable change, not platitudes, and are building power to hold leaders accountable. Youth-led direct action mobilizations have challenged the idea that young people have no interest in politics and global affairs. And they need their schooling to match. Teaching for environmental justice must go beyond school gardens, recycling, and green-themed assemblies. We need to put the learning directly in our students’ hands and give them real opportunities to be researchers in their schools and communities.
When I worked as a kindergarten teacher and curriculum specialist in South Los Angeles, most of my 5- and 6-year-old students brought plastic water bottles, juice boxes, or sports drinks to school because they said the water from the fountain “smells bad,” “tastes funny,” and “isn’t that white [clear].” We often had conversations about this when students unloaded their backpacks in the morning and put their drinks in their cubbies. During our year together we learned about neighborhoods and communities, and my students, majority Black and Brown, came with plenty of background knowledge. Everyone had findings to report from their journey through the neighborhood as they made their way to school. Students made observations about the trash in the streets and the smell of gasoline from living in an area with heavy traffic. They also commented on the lack of clean drinking water at school.
Youth-led direct action mobilizations have challenged the idea that young people have no interest in politics and global affairs. And they need their schooling to match.
My students were quick to recognize that there aren’t a lot of green spaces where they live. At the beginning of the year and during the spring, students would often be exhausted after recess due to the heat. They frequently said, “There’s no shade,” “I want a tree to sit under,” and “It’s too hot.” Several students also remarked how “on TV there’s trees and cool slides on playgrounds.” I asked, “Where do the characters live?” They couldn’t remember where the setting was, but said “it must be far away, because the park is far away too.” They asked if other neighborhoods and cities “have problems with no trees and parks” and why.
At a young age, students are aware of inequities, and my students’ sharp observation skills allowed us to investigate issues of environmental injustice in our community, such as access to green space and pollution. To seek answers to the student-initiated question on whether other cities “have problems with no parks and trees” and why, we used students’ knowledge of the neighborhood, learning from previous units, and a variety of mapping and GIS tools.
During the year, kindergarteners learned about maps and their features, how to identify symbols, and how to use the compass. They examined maps of California from the past and the present, and maps of their city. They also made maps of their neighborhood and the school. All of this information gave them a solid foundation for understanding issues of justice related to our environment. In the kindergarten context, this means tapping into their strong literal understandings of what’s fair and not fair, and their enthusiasm for learning and taking action.
The Research Process
To expand on their foundational understanding, I said, “I know many of you have been talking about the lack of trees on the playground and around the school and wonder why the parks are far away. Why don’t we find out why that is? What can we do to find out?”
Liliana and Mateo said, “We need to ask the computer!”
“Great idea!” I said, explaining to the students that we’re scientists and scientists do three things:
1. They notice something and ask a lot of questions.
2. They find out information in different ways.
3. They do something about it.
Students had provided their observations and questions, so now we engaged in finding information, and “asking the computer.”
The first step in “asking the computer” and doing research was to look at Google Maps to determine the location of parks and green spaces in proximity to the school. Students sat on the rug and I projected the Google Maps images onto the whiteboard. On the bottom left corner, there’s a small square button that says “layers.” I clicked on it, and then selected the button that says “more.” I set the map type to the default map view. This provides a clean and simple interface with colored visuals that’s easy for young learners to read. I typed in the name of our school using the search function in the upper left corner, and students helped me spell the name of the school to practice their letters. I asked student volunteers to identify the school and some features of the map.
Jadyn came up to the board and identified the streets and, pointing to horizontal lines, said, “These are the streets. There’s a capital E here, that’s the street name! This is a bus stop! I know because there’s a bus [picture] here! My mom rides that bus to work!”
Manuel said, “Here [the area around the school] is all gray! All I see is gray! There’s just buildings and streets.”
“Yeah!” said Valentina. “No green for plants or brown for Earth or blue for water!”
“How far away is the closest park?” I asked.
“Far!” Jamal exclaimed. “My brother plays baseball and we have to take a bus and walk a lot!”
Gabriela exclaimed, “There’s a soccer field at the high school! But that’s far too!”
Next, before I used the zoom function to give a wider view of the surrounding area, I said, “You are the experts in your community. You know the park and green spaces are far away. The map gives us a bird’s-eye view of the area. Pretend you’re a bird.” Students put arms out and flapped their wings for a minute.
“How far away is the closest park?” I asked.
“Far!” Jamal exclaimed. “My brother plays baseball and we have to take a bus and walk a lot!”
“OK, so if you’re a bird and we’re hovering here above the school, we know that as we go up higher in the sky, our view gets wider and bigger. So my birds, how many times do we have to fly up in the sky until we see green spaces?” I demonstrated with my hands that in this case the bird would fly straight up for the view. Students predicted: seven, five, 10, and two.
Next, the students counted the number of times I had to press the minimize button before we saw other colors besides gray. After pressing the button three times, my students said, “Stop! Green! It took three times! That’s far!”
I said, “Great! Now we have our bird’s-eye view. That’s height. We also want to know the length and distance too. What is the distance in blocks from the park to the school?” I asked for student volunteers to come up to the board and count the distance from the school to the parks. Students drew upon their prior knowledge of reading maps and counting blocks. The majority of students agreed that the closest park was seven blocks away.
Imani said, “Wait! There’s a freeway! We have to go down this way three more times [three more blocks] to get to the park because we can’t cross the freeway! You’ll get hit [by the cars]! There’s a road that crosses here!”
I asked, “If we need to go three more blocks, how many blocks total is that?” I had students discuss in “think-pair-share” groups.
After students discussed their answers, I asked a second question, “Some of you have been to this park before. How do you get there? Do you walk?” I wanted my students to make connections about distance and transportation.
Many students replied that walking to the park is not possible because it takes “forever and ever” and “is too far.”
Charlotte said, “My brother plays soccer there sometimes, but we take the bus because it’s too far and you shouldn’t walk at night over there. My mom says it’s not good [safe].”
Many students chimed in and said that their families take the bus to go places. This resulted in many students commenting on the “smells” and “noise” from all the buses and cars near the freeway. With plenty of ideas, students needed a way to record their thoughts and data.
My students had scientist notebooks. Due to limited funds, I made these by stapling together printer paper and recycled paper vertically, so there was plenty of room to write and draw. Students decorated the front covers.
I asked students to draw their findings of the distance from the school to the park and what transportation they would need to get there. Many students drew some variation of the school, a freeway, the bus, the park, the number 10, and some arrows. For a comparison, over the course of several days, we did the same thing for two other schools in more affluent cities in our county. Students recorded findings in their scientist notebooks.
Students also learned to read simple graphs during the year. To practice reading data, I made a giant class bar graph on chart paper so we could compare the distance from the parks for three different schools in our county. Students told me their findings, and I recorded them on the graph. Students noticed that one school had a green space seven blocks from the school, and the other had a green space three blocks from the school.
When my back was turned and I was writing on the board, I heard “that’s not fair!” along with some echoes of agreement.
I turned around and said, “You’re right, it’s not fair. Remember we have been learning about grown-ups and children in the past and in the present who see or experience something that isn’t fair. What do those people do? What do we do?”
“We gotta do something!” said Liliana. “Then we gotta tell lots of people with words, writings, or talks [speeches]!”
“Yeah, or when people don’t buy something [boycott],” added Marcos.
“Or we go to the streets! [protest],” said Ximena.
“Some people go to the library and get books to learn more!” added Luke. “Researching!”
“Exactly, everyone!” I said. The students were energized with new motivation and purpose. I told them that we would keep working and researching.
“OK, look at your research notebooks and your drawings. How do we get to all of these parks?” I asked. I was trying to get them to make connections about distance and access. I had students discuss in their think-pair-share groups.
Students concluded that to get to the green space by our school, you would have to cross a busy freeway with a lot of traffic and it’s difficult to walk. They were quick to notice that wasn’t the case for the other schools and you can probably “walk,” “ride a scooter,” “ride a bike.”
Michael said, “We gotta cross the freeway and take the bus! That’s a whole journey! And that’s not good for the Earth [due to the exhaust] and there’s a lot of bad smells [gasoline and exhaust smells].” This resulted in a chorus of “it’s the freeways!” and “that’s a lot of pollution!”
Pollution and Air Quality
I wanted to follow this line of connection and inquiry that the students had established. They were noticing connections between tree cover and temperature (things they had noticed earlier on the playground), urban environments, transportation and access (far distances to the parks), and transportation and pollution.
I said, “I wonder if there’s more or less air pollution in the cities around the other schools? Maybe we should investigate!”
Students enthusiastically agreed that more research had to be done. So we next used CalEnviroScreen, a mapping tool from the California Office of Environmental Health Hazard Assessment, to examine the levels of air pollution. The percentiles of pollution are colored in various shades of green (lowest percentile) to red (highest percentile). The visual data and color coding makes it easy for young learners to understand. Using CalEnviroScreen, I first showed the zoomed-out page with our entire state.
“Where do you see different colors? Why do you think that is? What can that tell us about the air quality and the amount of pollution?” I asked. Students talked to their peers in a think-pair-share, and then we discussed it as a class.
Many shared answers of “the red is bad [polluted] air,” and “green is clean air,” and “pink is like medium, but still kinda bad air [different level of pollution].”
“Look over here,” Isiah said, pointing to the center of the map. “There’s a long area of red here!”
During the year, we also learn about California, so I had previously taught students about the agricultural industry in California’s Central Valley. Michael remembered, “Look! Here’s where they grow the food!” and pointed to the middle of the state. “It’s really red here!”
“Yeah! Because there’s a lot of cars and machines! And mountains! The mountains trap bad air!” said Ximena.
“That’s bad for the farmers and the growers [referring to farmworkers]!” said Tommy.
We searched for our city, and the two additional cities where we studied the parks and schools. I gave students a blank outlined map of California and glued it into their scientist notebooks. Students used crayons and colored pencils to record the findings and color variants. I put up our class bar graph we made earlier so students could see it. I showed students the cities where the three schools were located on the CalEnviroScreen map. Then I said, “Now find the page in your scientist notebook for our school. What color is the air in our city?”
Students said, “Red! A lotta red!”
“Good,” I said. “Now take your crayon and make a note of your findings. That’s what scientists do.”
After they finished, we did the same process for the other two schools.
“OK,” I said. “Now talk to your partner about what you found. Is there a connection between how we get to the park and the quality of the air?”
When speaking of the findings, Chris said, “In the places with no trees and more freeways like we have [referring to urban environments with a lack of tree cover], there’s more red air [meaning polluted air].” Michael said, “red [meaning red the color] is hot too! It’s always hot here [in our city]! In the summer it’s too hot and recess is too hot!”
This showed me that young learners like my students have an understanding of the concept of urban heat islands, and how temperature, air quality, and tree cover are all interconnected and related. Students had initially wondered about access to green spaces, and had earlier noticed tree coverage and temperature. Using CalEnviroScreen and engaging in research helped them make more connections.
Hilberto remarked, “Yeah, because trees make the air clean and cool.”
Luisa said, “Clean air, lots of trees! We need more trees!”
I compiled all of the students’ findings from their notebooks into a “research report” and we gave it to the principal, our families, and then mailed another copy to a city council member. Some research conclusions were “We have a lot of freeways. We need to walk places. Too many freeways and cars is bad air.” “Recess [and the playground] is hot. I want to sit under a tree. Trees give shade and clean air.” “I don’t want to ride a bus to see trees or play in the park. Why isn’t it closer?”
I was humbled by my students’ abilities to ask critical questions and call out the inequities that they saw and experienced. Young learners are perfectly primed to do research on local and global issues through the use of GIS tools, informational texts, read-aloud books, and interviews. My role as a teacher was to guide and facilitate their learning and research, and to encourage them to make their own connections and conclusions. We need an education that will sustain the expression and motivation of young student activists and political voices, and an education that will give students tools and opportunities for student-led research so they can shape and change public policies to address environmental injustices. Political institutions, schools, and elected representatives need to share power with young people to offer them real opportunities for social change.