Macaroni Social Justice
I’m always on the lookout for ways to make math lessons more interesting to my students and more connected to real social issues. When visiting the San Francisco Exploratorium last year, I happened upon a great exhibit about wealth inequality and realized the perfect ingredient that would do both: macaroni.
The exhibit showed three bar graphs:
1) How we think wealth should be distributed among the United States population.
2) How we think wealth really is distributed among the population.
3) How wealth is actually distributed among the population.
The bar graphs are divided into fifths, segmenting the population from poorest fifth to richest fifth. This fractional division is what gave me the inspiration to use this lesson as a realistic application of our current unit on fractions. I was shocked by the exhibit and couldn’t wait to see my students’ reactions.
My students’ families speak 12 different languages and have a wide range of backgrounds and incomes. Most are second-generation immigrants from Mexico, India, Egypt, Pakistan, Iran, Nigeria, China, the Philippines, and many other countries. Socioeconomically, these families range from working class to wealthy. These disparities are rife with possible conversations and exploration, but I have struggled with how to discuss issues of class and wealth inequality with 8- and 9-year-olds. I hoped that by the end of this lesson, students would have an introduction to the idea that in our country there is an unfair imbalance of wealth. By conveying this lesson through fractions, I anticipated that this concept of inequity would stick with them since it was directly relevant to our curriculum and could easily be framed by that lens.
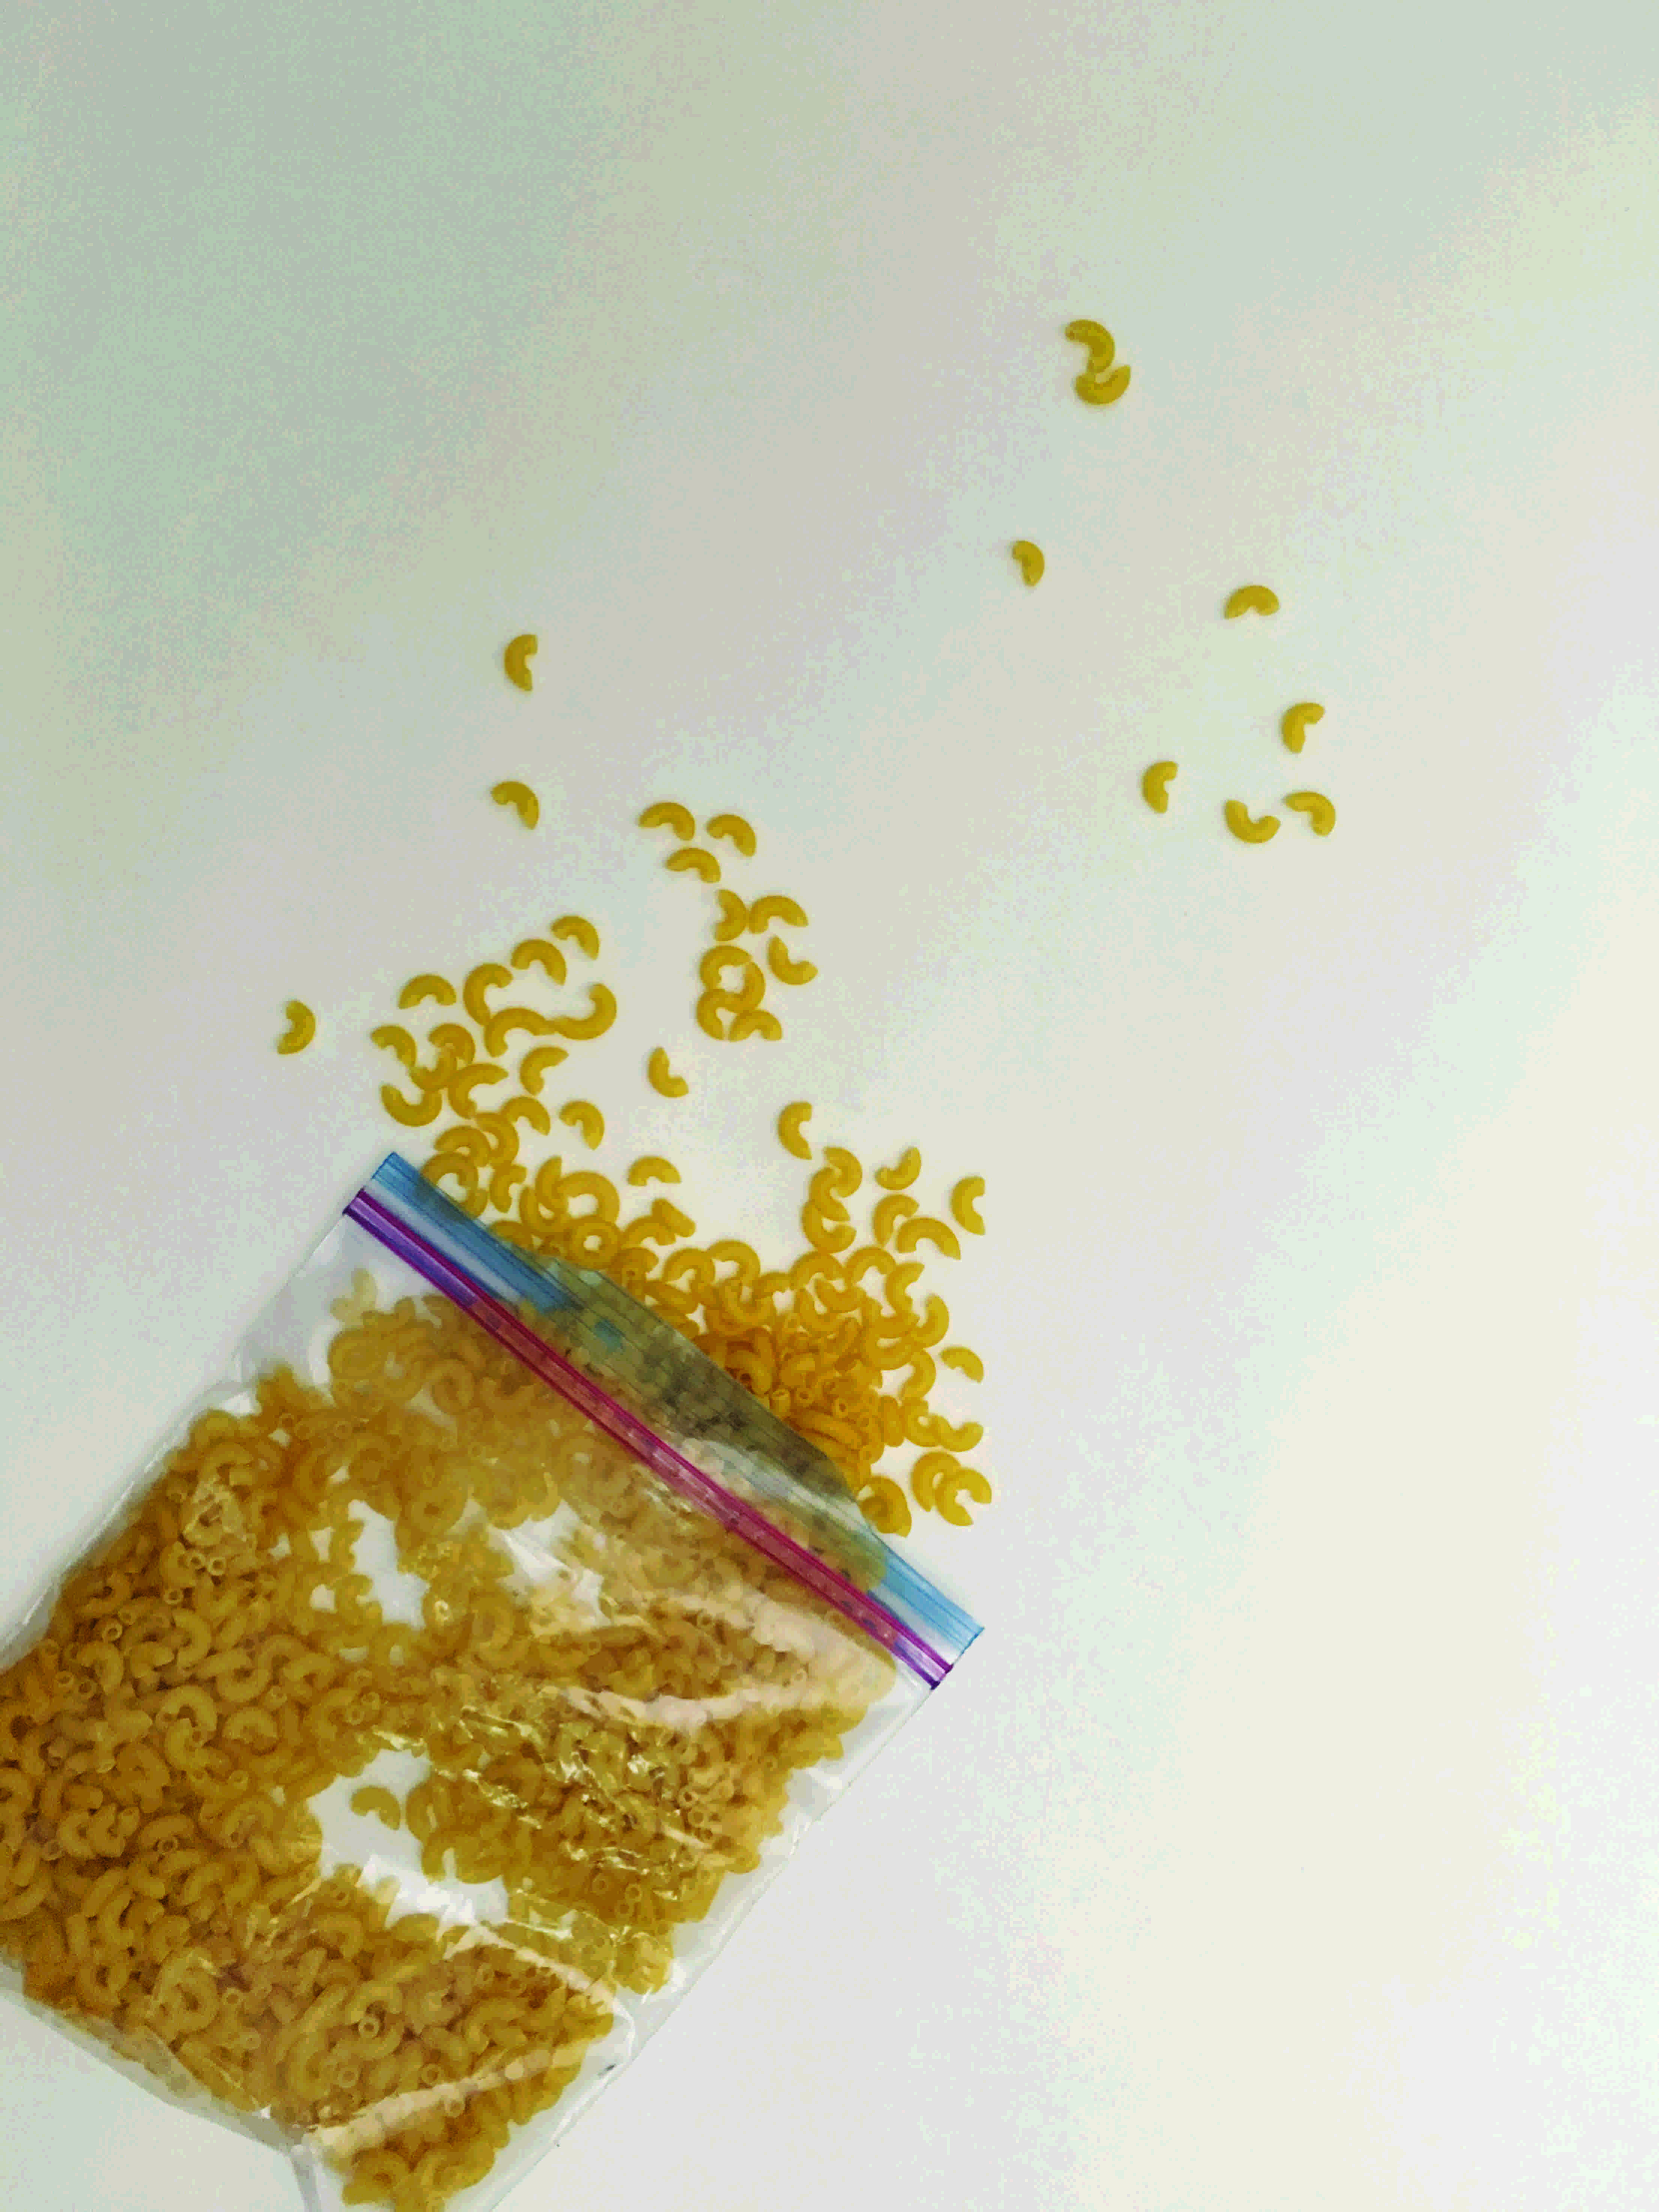
At the beginning of the math lesson on Friday, I broke students into six groups of four. I dumped out some boxes of macaroni for each group, and had the students put the pieces of macaroni into groups of 10. Every time they reached 10 groups of 10, they put the 100 pieces of macaroni into a Ziploc bag. At this point, the students had no idea why they were counting macaroni pieces. I did this intentionally because keeping an element of mystery as long as possible in my lessons usually sparks greater interest and engagement from the students. I teach 3rd graders and during the course of counting out the pieces of macaroni, I heard comments from multiple students like “Wow, this is the most fun math lesson we’ve ever had!” and “This is the best day ever!”
Once students finished counting and bagging their pieces of macaroni, they came over to the rug that I divided into five equal parts using pieces of masking tape. We had just begun our study of fractions the previous week, and so far we had covered a few basic concepts: fractions being equal parts of a whole, different numbers of equal parts being called different things (three equal parts are called thirds, four equal parts are called fourths), and understanding what different amounts of these parts are called (e.g., if we shade in one piece of a whole divided into four parts, that shaded piece is called “one-fourth”).
When students gathered at the rug, I had them share with a partner what they saw on the rug. Students said things such as “There are five equal parts” and “The rug is divided into fifths,” indicating to me that they could apply their understanding of fractions to this concrete example. We then reviewed the idea that a fraction is when you divide something into equal parts, and these ones are called fifths because there are five of them. Next, I explained the purpose of the day’s project: We were going to make fractions relevant to their lives by showing the distribution (spread) of wealth (money) in our country. Each fifth on the rug represented one segment of society: the poorest fifth, the second-poorest fifth, the middle fifth, the second-richest fifth, and the richest fifth.
We then put all the bags of macaroni together and counted them as a class: 90 bags total. Nine thousand pieces of macaroni (there was no specific reasoning behind having 9,000 pieces of macaroni — the students were allowed to bring in as many pieces as they wanted, and we ended up with 9,064, so I removed 64 to get an even 9,000). I told the students that the macaroni represented all the wealth in the country. I didn’t expect students to fully grasp the real numbers representing the wealth in our country, so I used the macaroni to create a compelling visual of wealth and to get at the proportional reasoning and root unfairness behind the distribution of wealth.
“First, let’s talk about the word ‘wealth’,” I said. “Does anyone know what that means?”
Mimi raised her hand. “I think it’s how much money you have,” she suggested.
“Exactly!” I proclaimed. “Think of wealth as all the money in the country in addition to all the things that money can buy — the cars, the houses, the buildings, even toys — all the things that everyone owns.”
I then explained that the population of the United States represented the whole (one of the key terms of our fractions unit). Next, students met with their groups to guess how many bags of macaroni each fifth of the population actually has.
“Hmmm, I’m not sure,” pondered Alejandra. “I know the richest people are going to have more, but how much more?”
“I don’t know . . .” considered Jazmn. “I bet the richest people have at least 30 bags.”
“No way!” exclaimed Bishop. “That is way too many.”
“But they have mansions and stuff!” said Alejandra. “That must cost a lot of macaroni!”
The conversations continued on like this for a few minutes. Then, the students came back and I used the bags of macaroni to show their predictions on the rug. The average prediction of the students was around five bags for the poorest fifth, 10 bags for the second-poorest fifth, 20 bags for the middle fifth, 25 bags for the second-richest fifth, and 30 bags for the richest fifth.
I then sat down in the poorest fifth and told the students that it was time to see how the wealth was actually distributed. I dramatically pushed the bags from their prediction into the neighboring fifth until there was only one bag sitting in the poorest fifth. The students let out a collective gasp. I then opened the bag, and as they realized what I was doing, they started crying out “What? How?” I reached into the bag, pulled out macaroni pieces, and dropped them onto the rug until there were nine pieces sitting in the poorest fifth. When I told the students that was it, they stared back at me in disbelief. “Sixty million people,” I said. “Nine pieces of macaroni.” Nine pieces of macaroni represents .001 percent of the wealth in our country. I was able to quickly calculate how many pieces of macaroni to put into each fifth using the calculator on my phone. Before the lesson, I wrote down the values from the exhibit at the Exploratorium on a piece of paper. When the students counted out the macaroni and found that we had 9,000 pieces, I multiplied each of the five values by 9,000 to determine how many pieces to put in each fifth.
I then moved to the second fifth. There were 14 bags sitting there now, since I had pushed over all the ones from the poorest fifth prediction into this one. I scooped up the bags and dropped them one by one into the neighboring fifth. I kept the open bag from the poorest fifth in my hand, pulled out a measly 18 pieces of macaroni, and dropped them onto the ground. “Sixty million more people,” I said. “Eighteen pieces of macaroni.”
As I scooched over to the middle fifth and prepared to shove the bags over once more, I was met with cries of “Noooo!” from all the students. They were begging me that it wasn’t true. This gave me motivation to make the presentation of this material as dramatic and memorable as possible. “Oh yes,” I said. “I wish I were joking, but this is the truth, friends.” I had 34 bags sitting in the middle fifth at this point, accumulated from the students’ prediction, and I plopped them one by one into the neighboring fifth, leaving only one full bag sitting in the middle fifth. I then gently placed down the half-full bag from the previous two fifths in this section as well. “One and a half bags,” I said. “Can you believe this? We have now covered three-fifths of the population. Ninety bags of wealth in total. Only two used so far.” As I moved into the second-richest fifth, I was met with more resistant cries. I shoved the bags over into the richest fifth, and we were left with only nine bags sitting in the second-richest fifth. As I moved over to the richest fifth, we counted the bags out loud together: one, two, three, four . . . all the way up to the grand total of 79. The visual of the distribution of the macaroni was staggering: the nine puny pieces of macaroni all the way to the left, and the abundance of dozens of bags all the way to the right.
“What the heck just happened?” I asked the students. Their hands shot into the air. At this point, a lesson on fractions morphed into a discussion of economics and social justice.
“I can’t believe this,” Talvir said. “This is unfair. The rich people should give their money to the poor. I can’t believe it.”
“The people in the richest fifth need to give their money to the homeless,” added Malaya. “The homeless don’t have any money.”
“But the rich don’t even know that the poor don’t have any money,” Elijah said.
“They don’t care anyway,” said Cassie.
“That’s very interesting, Elijah,” I said slowly. “Why do you think the rich don’t know that poor people don’t have money?”
“Well, if they did, wouldn’t they have given them money already?” he asked.
“But some people with lots of money think it belongs to just them and no one else,” I said.
“What?” the kids gasped.
“That’s one of the things about our country that isn’t very fair,” I explained.
Reflecting on this statement, I now realize this could have been an opportunity for students to come to this conclusion by thinking out loud together. I could have prompted them to look at the rug again and decide how they think wealth should be distributed, as the exhibit that inspired this lesson did. I could even show them the original graph from the exhibit, and have them evaluate its fairness. Either way, when I teach this lesson next year this will be an opportunity for students to come to their own conclusions as a group, rather than me offering my own opinion.
One student, Mimi, was able to synthesize this information and come up with a new thought. She raised her hand. “Isn’t that kind of like racism, like we talked about before?”
“What do you mean?” I invited her to explain.
“Well, that’s another thing in our country that happens a lot but isn’t fair. People aren’t getting treated equally. It’s like how some people have much more money than others. It’s just not right.”
“Very true, Mimi,” I responded. “Good thinking. I’m so glad to see you making connections with our prior learning.” Looking back, this would have been a great opportunity to guide students toward the previously unexplored connection between poverty and racism. I could have asked something like “Do you think it’s a coincidence that this is reminding you of racism? Do you think poverty and inequality could be connected to racism?” While I probably would have saved a larger conversation about this intersection for another day, it would have been interesting to hear what students were able to come up with.
The conversation continued like this for a few minutes, and while I maintained my face of concern and respect as the students shared, I was beaming inside. I was overwhelmed that my students were both beginning to understand these complex concepts and that they cared about them. I felt this was a great start, the foundation upon which to add more ideas about wealth disparities. The kind of connections that the students were beginning to make between issues of wealth inequality and racism could lend themselves to deeper discussions about the roots of wealth inequality and the relationship between race and class later in the year. While in this lesson I hoped students would start to see that there is a connection between racism and wealth inequality, in later discussions I hope to guide students toward understanding that this connection is no coincidence, and that racism and racist policies have fueled wealth inequality for centuries. The next time I teach this lesson, I would like to plan it even more intentionally to coincide with conversations about race and class so we can dissect those issues in conjunction with each other.
This lesson seemed to be particularly effective because the students were actively involved in the process. It engaged them in a way that a hands-off lesson never could have. Having the visual representation of wealth inequality also made the abstract concept easier for them to grasp. While the original exhibit had three graphs, I chose to use only the graph showing how wealth was actually distributed in our country.
To wrap up the project, students completed a worksheet where they drew the wealth distribution we found using fifths, wrote about what we did in the activity using math vocabulary words like whole, fifths, and wealth, and reflected on what they learned from the lesson. I also had them translate the macaroni representation into bar graph form. (I modeled doing this for the first two fifths, and they completed the last three with their table.) This was a way to solidify their understanding of the disparities between the fifths, while also extending their math conceptual understanding by having to translate one form of data to another. Looking at their completed worksheets, I saw that every student was able to successfully complete the bar graph. This showed their basic understanding of the concept of fractional units (fifths) and the fact that these fractional pieces together make a whole. In their reflections, students wrote comments such as “We need to do more” and “People need to know about this.” The three parts of the worksheet (the bar graphs, the written explanations of what we did, and their reflections) together demonstrated that they not only understood fractions better, but also that they were wrestling with the alarming wealth disparities within the population, a concept they intuitively grasped as patently unfair. Their understanding of this material was manifested subsequently, when, inspired by our opinion letter writing unit, a student suggested writing letters to the mayor of Sacramento about wealth distribution in our city.
At the end of the day, I asked the students to raise their hands if they were going to go home and tell their families about what we learned. Without missing a beat, every single student’s hand flew into the air.